2012-07-20 05:08 GMT
The USD is weakened by lackluster jobs data as earnings soar.
Asian stocks are trading mixed early this morning with gains in China and Japan whereas the Kospi and Hang Seng indices show slight declines. The euro has also given up its overnight gains as it trades below the 1.23$ mark. Weaker jobs data from the US has increased pressure for the world’s largest economy. European shares soared to a four month high on Thursday as another string of estimate-beating corporate results surprised investors who had braced for a weak show. U.S. Stocks closed higher for a third-straight session in choppy trading Thursday, with the S&P 500 hitting its best level since May, but gains were limited following some disappointing economic reports that underscored ongoing weakness in the recovery.
On the economic front, German PPI is to be closely watched. These are expected to come in higher at -0.20%, versus the -0.30% previously. This could provide affect support to the euro in the European session. There are no major data releases from the U.S.
Crude oil and gold continued to climb in yesterday's session with tensions in the mid east rising pressurizing prices
Read More
|
|

2012-07-20 06:00 GMT
Germany - Producer Price Index (Jun)
2012-07-20 08:30 GMT
UK - Public Sector Net Borrowing (Jun)
2012-07-20 n/a
EMU - European Council meeting
2012-07-20 12:30 GMT
CAD - Consumer Price Index (Jun)
|

2012-07-20 04:26 GMT
EUR/USD waiting for Eurogroup below 1.2300
2012-07-20 02:35 GMT
USD/JPY at session lows, bear trend intact
2012-07-20 02:32 GMT
EUR/JPY at session lows below 96.50
2012-07-20 01:45 GMT
EUR/USD set to end week unchanged
|
|
|
|

|
|
EURUSD Connection timeout
|
|
|
|
|
|
|
|
|
SUMMARY

Down
|
TREND

Down
trend
|
MA10

Bullish
|
MA20

Bearish
|
STOCHASTIC

Overbought
|
|
|
|
|
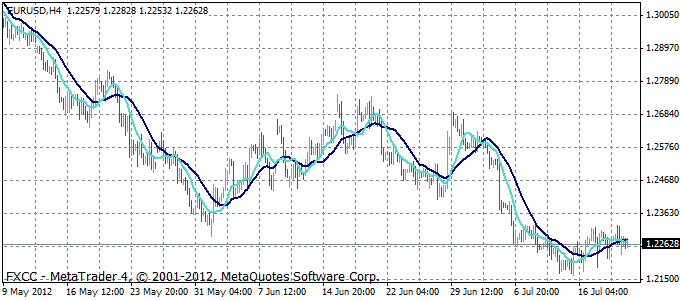
MARKET ANALYSIS - Intraday Analysis
The pair has worked out the Flag figure and declined to 1.21813. Despite the attempt above 1.2316, there is nothing about the action to suggest that this is an important turn. It’s possible that a high is already in place at 1.2316 but any additional strength should be capped by 1.2333. The pair managed to move above the middle resistance. It retested the level and is now trying to recapture 1.23. This upward move is probably a correction and the downtrend will resume toward 1.20. Support lies at 1.2210 and 1.2160.
-
|
|
|
|
|
|
SUMMARY

|
TREND

Up
trend
|
MA10
Bullish
|
MA20

Bullish
|
STOCHASTIC
Overbought
|
|
|
|
|
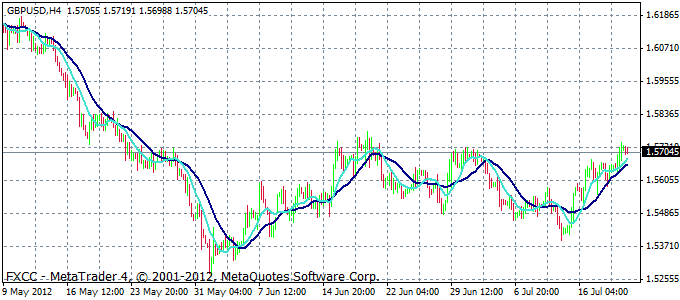
MARKET ANALYSIS - Intraday Analysis
Signals are bullish as near term resistance at the 50 day MA 1.5629 has been broken, the pair is aiming to the MA 100 at 1.57071. The technical pattern is being reinforced by resistance created by the 1.5740 June 17th high. Further barriers above are likely to compound the sentiment, at the 1.5750 figure. MACD is additionally supportive of a short term retracement, showing a sharp bearish divergence in the hourly time frame. Supports are seen at the 21-DMA line at 1.5585 and then at the 10-DMA line at 1.5563. On the other hand, resistance levels are seen at 1.5722 and then at 1.5731 which is the 21-DMA upper Bollinger level.
-
|
|
USDJPY Connection timeout
|
|
|
|
|
|
|
|
|
SUMMARY
Down
|
TREND
Down
trend
|
MA10

Bearish
|
MA20
Bearish
|
STOCHASTIC
Oversold
|
|
|
|
|
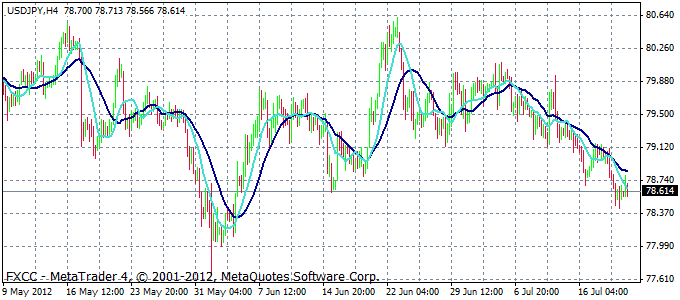
MARKET ANALYSIS - Intraday Analysis
Technicals remain bearish and the decline continues following breach of 200 day MA 79.07 but signals are moving to the overbought zone. The pair is completing a Head and Shoulders, the first aim was 79.070 which is has broken and the 2nd aim is at 78.345 to complete the move. It has breached temporary support from the lower channel line of the move down and it is possible it may rebound from here although there is not strong reversal pattern yet. A move above the 76.4% Fibonacci line at 79.02 would encourage an upward reaction.
-
|