2012-07-18 06:00 GMT
Fed Bernanke Keeps Mum... no additional clues
Asian markets have started the day off mixed after US markets rebounded amid hopes for further monetary easing in the United States.
The comeback was triggered after Federal Reserve Chief Ben Bernanke gave a gloomy assessment of the economy to Congress and said the Fed would act if the situation worsened, exactly as he had stated after the June FOMC meeting and as stated in the FOMC minutes.
In New York, the Dow Jones Industrial Average closed at 12,805.54 on Tuesday, gaining 78.33 points (0.62 per cent) and more than erasing Monday's losses.
The Nikkei 225 index at the Tokyo Stock Exchange opened up 41.15 points at 8,796.15 this morning. The Hang Seng Index was off by 77.12 points, or 0.4 per cent, to 19,378.21in early trading.
Market focus will shift back to the eurozone as we should see Spain and Italy back in the spotlight.
Commodities and currencies ended pretty much where they had begun the day.
Read More
|
|

2012-07-18 08:30 GMT
UK - Bank of England Minutes
2012-07-18 09:00 GMT
EMU - Construction Output s.a (May)
2012-07-18 12:30 GMT
US - Building Permits (Jun)
2012-07-18 14:00 GMT
US - Fed's Bernanke testifies
|

2012-07-18 04:40 GMT
NZD/USD may enter fresh 0.8005-0.8075 range soon
2012-07-18 04:29 GMT
GBP/USD steady around 1.5650 ahead of BoE
2012-07-18 04:17 GMT
EUR/USD failing to break above 1.2300
2012-07-18 04:11 GMT
China House Price Index flat at -1.5% in Jun
|
|
|
|

|
|
|
|
|
|
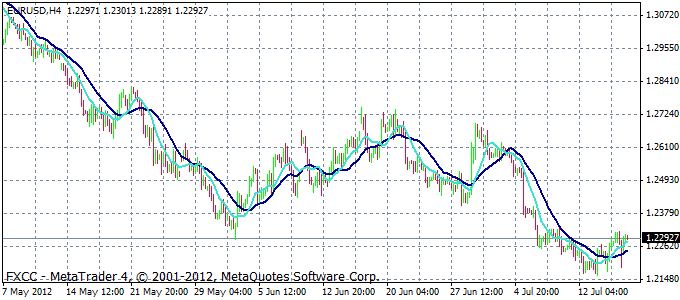
SUMMARY

Down
|
TREND

Down
trend
|
MA10

Bullish
|
MA20

Bearish
|
STOCHASTIC
Oversold
|
|
|
|
|
MARKET ANALYSIS - Intraday Analysis
Technicals remain bearish, but a breach above last week’s high of 1.2336 could change the outlook. The EURUSD rally from 12161 is corrective which can often be a choppy, sideways affair. The initial stop is above 12440. This rally extended to above 1.23 by the today's Asian session. The 1.2320-1.2330 area is the resistance of a previous near-term consolidation. RSI in the four-hour chart is almost 60. If the market is to retain the bearish momentum in this time-frame, the RSI reading tends to find resistance at 60. The one-hour RSI is showing some bearish divergence. A break above 1.2330 exposes the 1.24 key resistance level.
-
|
|
|
|
|
|
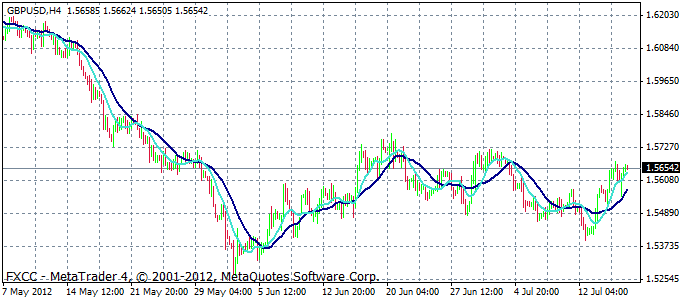
SUMMARY

|
TREND

Up
trend
|
MA10
Bullish
|
MA20

Bullish
|
STOCHASTIC

Overbought
|
|
|
|
|
MARKET ANALYSIS - Intraday Analysis
Technicals remain bullish with a shift to neutral with strong resistance at 50 day MA 1.5647 could limit further gain. The sterling rally has carried price into channel resistance. Resistance is reinforced by the low at 15641 and channel that defines the rally from 15392. The pair continued to struggle around SMA 50 but the bullish sign on Stochastic remains intact. Our outlook keeps the bullish scenario for the rest of the day; noting that a break above 1.5680 will confirm and accelerate the bullish direction towards 1.5780.
-
|
|
|
|
|
|
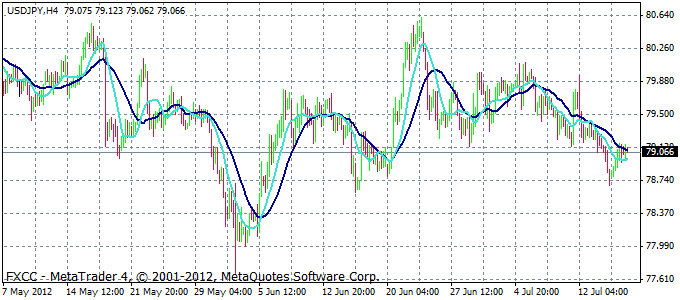
SUMMARY
Down
|
TREND
Down
trend
|
MA10

Bearish
|
MA20
Bearish
|
STOCHASTIC
Oversold
|
|
|
|
|
MARKET ANALYSIS - Intraday Analysis
Technicals remain mixed and are hovering close to key 200 day MA 79.05 and declines are limited below 78.80. The pair has reached the -2nd Bollinger band for the first time since early June. The pair has been trapped within a very narrow range since attempting to stabilize at the 79.00 levels. Meanwhile, RSI 14 continued to stabilize below the value of 50.00 suggesting further losses over intraday basis. 7890 is the important support line, if price breaks through we could see a decline to the wide support zones between 78.20 and 77.95. The current trading range is between the key support at 77.60 and key resistance at 80.30.
-
|