|
|
|
|

2012-07-17 5:33 GMT
Fed Chairman Bernanke begins his testimony before congress today.
Asian markets started off mixed today, after Wall Street tumbled over an unexpected fall in retail sales in June.The Nikkei opened 0.19 %, or 16.86 points, higher at 8,740.98 this morning, but soon dropped into negative territory. In Hong Kong, shares climbed 1.39 %.
The Hang Seng Index added 266.29 points to 19,387.63.
Investors will continue to be cautious before a slew of US high risk eco data, including June industrial output as well as Fed Chairman Ben Bernanke's two-day testimony in Congress due today.
Markets stressed over global growth worries after the International Monetary Fund on Monday trimmed its 2012 global growth forecast to 3.5 % from its 3.6 % forecast three months ago.
US retail sales fell by 0.5 % last month, the Commerce Department reported. Most analysts estimated an increase 0.2 %.
The Dow Jones fell 49.88 points (0.39 %), closing at 12,727.21.
The US dollar spent the day on a rollercoaster; bring its trading partners up and down throughout the trading day, the euro dipped as low as 1.2167
Read More
|
|

2012-07-17 08:30 GMT
UK - Consumer Price Index (Jun)
2012-07-17 09:00 GMT
UK - BoE's Governor King Speech
2012-07-17 09:00 GMT
EMU - ZEW Survey - Economic Sentiment (Jul)
2012-07-17 09:15 GMT
All - G7 Meeting
|

2012-07-17 04:24 GMT
GBP/USD trades at 2-wk highs, UK data ahead
2012-07-17 04:19 GMT
EUR/USD around 1.2300 ahead of ZEW
2012-07-17 03:50 GMT
Forecast UK CPI inflation to fall to 2.7% in June - RBS
2012-07-17 03:27 GMT
EURJPY continues at risk; three month target at 94 - UBS
|
|
|
|

|
|
|
|
|
|
SUMMARY

Down
|
TREND

Down
trend
|
MA10

Bullish
|
MA20

Bearish
|
STOCHASTIC

Oversold
|
|
|
|
|
MARKET ANALYSIS - Intraday Analysis
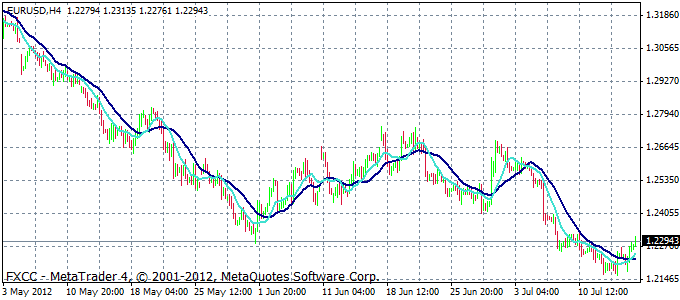
Long term technicals remain bearish, with all signals in sell territory. Prices rose to take out resistance at 1.2249 after breaking above key support at 1.2177, a level dating to 2010. The bulls now aim to challenge upside barriers at 1.2333 and 1.2433. Near term signals are all reading bullish. The 1.2249 level has been recast as near-term support. Back to our daily charts, RSI remains below 60 after tagging 30, showing maintenance of a bearish momentum. And we can see a negative reversal signal with the RSI where price high was lower, while the RSI high was higher. Supports are seen at 1.2162 and then at 1.2100 whereas resistance levels are seen at 1.2314 and then at 1.2330, which is the 10-DMA line.
-
|
|
|
|
|
|
SUMMARY

|
TREND

Up
trend
|
MA10

Bullish
|
MA20

Bullish
|
STOCHASTIC

Overbought
|
|
|
|
|
MARKET ANALYSIS - Intraday Analysis
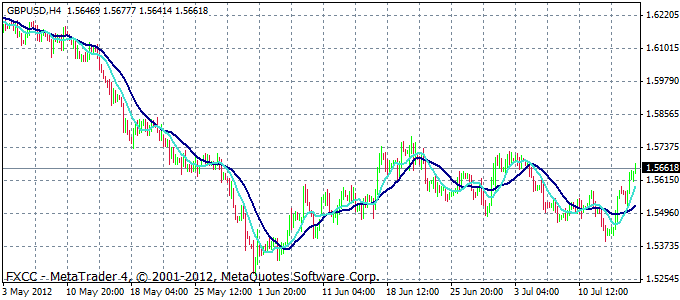
Technicals all support a bullish move today between the 9 & 21 day MA’s 1.5622 and 1.5689, respectively, The late strong rally has negated the bearish signals, however bias remains to the downside given the bearish bias of indicators. As for the key levels - there aren't any significant key levels now. The immediate intra-day bias is now on the upside above 1.5550. Break below 1.5500 may bring re-test on the last week's low near 1.5390. Supports are seen at 1.5518 and then at 1.5427 whereas resistance levels are seen at 1.5713 and then at 1.5734.
-
|
|
|
|
|
|
SUMMARY

Down
|
TREND

Down
trend
|
MA10

Bearish
|
MA20

Bearish
|
STOCHASTIC

Oversold
|
|
|
|
|
MARKET ANALYSIS - Intraday Analysis
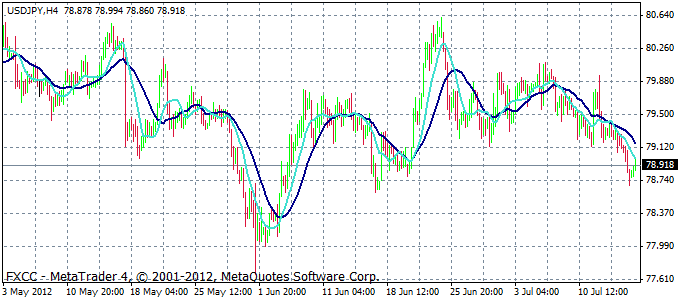
Technicals remain bearish and the pair has breached of 200 day MA at 79.04 which should allow for further decline. As the pair broke the 79.00 level nothing significant has happened. The move down remains extremely choppy and the decline is so slow, that this can hardly be said to be a downtrend. A move above 79.10 will simply turn the hourly chart neutral. Supports are seen at 78.65/61 and then at 78.10 whereas resistance levels are seen at the 200-DMA line at 79.02 and then at 79.40.
-
|
|
|
MARKET INFORMATION AND OPINIONS: Any information provided by FXCC
on this newsletter, including but not limited to news, research, opinions, analyses
and prices, is provided as commentary on the Forex market generally -- in other
words, it is not, and should not be considered as, investment advice. Consequently,
FXCC shall not be liable for any loss or damage, including but not limited to loss
of profits, which arises directly or indirectly from reliance upon or use of information
contained on this newsletter.
RISK WARNING: Trading in Forex and Contracts for Difference (CFDs) is highly speculative
and involves substantial risk of loss. It is possible to lose all your capital.
Forex and CFDs may not be suitable for all investors. Only invest with money you
can afford to lose. Please ensure you fully understand the risks involved before
investing. Seek independent advice if necessary.
|
|


