|
|
|
|

2012-07-11 05:11 GMT
China the main focus, with thin eco data as the EUR remains under pressure
Wall Street shares traded with a negative bias as they reviewed Chinese international trade data that implied that the Chinese economy is slowing. Energy prices fell, with WTI crude for delivery in August closing just under USD 84 per barrel and the August natural gas was trading at USD 2.73. CAD while USDCAD closed above 1.02 while EURUSD also sold off, closing at 1.2250. Equities were lower, with the S&P 500 down by 0.75% after being down as much as 1.2%. The TSX closed down by a steeper 1% amidst the selloff in basic resources and oil and gas names. Bonds were fairly flat.
It was a thin day in terms of economic data, with Canadian housing starts the only event on the docket. Canadian housing starts came in quite strong at 222.7 (that’s a seasonally adjusted annualized rate – not the actual amount of housing starts). The skew was radically tilted towards ‘multis’, which accounted for the lion’s share of the housing starts and all of the growth.
It should be a fairly quiet in terms of economic data releases. This is the week during which China releases its main economic indicators, and while there are no measures from the real side of the economy due to be released; there is a chance that the credit and money market metrics could come out
Read More
|
|

2012-07-11 12:30 GMT
US - Trade Balance (May)
2012-07-11 14:00 GMT
US - Wholesale Inventories (May)
2012-07-11 17:00 GMT
US - 10-Year Note Auction
2012-07-11 18:00 GMT
US - FOMC Minutes
|

2012-07-11 04:19 GMT
EUR/USD choppiness ahead of FOMC minutes
2012-07-11 03:49 GMT
Market smells disappointment from the BOJ - Nomura
2012-07-11 03:21 GMT
AUD/USD oscilates ahead of Aus jobs data
2012-07-11 02:22 GMT
EUR/GBP dips to fresh 3-1/2 year low under 0.7900
|
|
|
|

|
|
|
|
|
|
SUMMARY

Down
|
TREND

Down
trend
|
MA10

Bearish
|
MA20

Bearish
|
STOCHASTIC

Overbought
|
|
|
|
|
MARKET ANALYSIS - Intraday Analysis
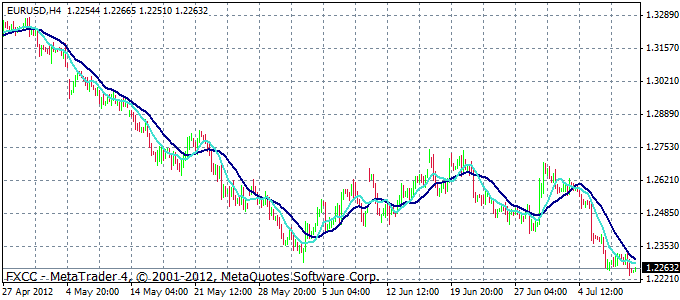
Technicals remain bearish with RSI at 32 indicates that decline has not yet reached oversold levels. The EUR continues to consolidated just above the recent lows and it seems it is preparing for the next leg lower and should bring us close to 1.2145. That bearish outlook is valid as long as the prices stay below the important 1.2345 Fibonacci level. Supports are seen at 1.2230, 1.2190 and then at 1.2151. Whereas resistance levels are seen at 1.2365, 1.2401 and then at the 10-DMA line at 1.2456.
-
|
|
|
|
|
|
SUMMARY

Down
|
TREND

Down
trend
|
MA10

Bearish
|
MA20

Bearish
|
STOCHASTIC

Oversold
|
|
|
|
|
MARKET ANALYSIS - Intraday Analysis
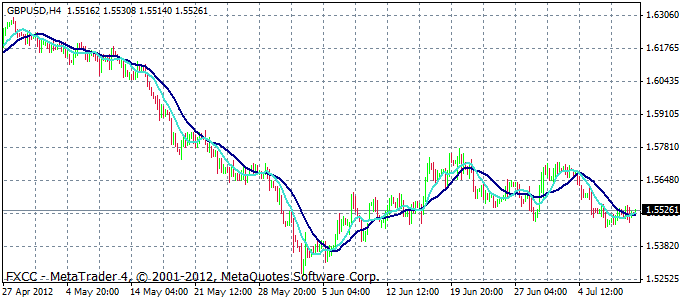
Technicals continue to read bearish - consolidation seen around 1.5500, with limited range. The outlook remains bearish and expects weakness near 1.5260 Fibo level. On the upside, a break above 1.5550 will negate this view and will suggest larger recovery near 1.5620Supports are seen at 1.5470 and then at 1.5448. Whereas, resistance levels are seen at 1.5551 and then at the 10-DMA line at 1.5580, followed by the 21-DMA line at 1.5601.
-
|
|
|
|
|
|
SUMMARY

Down
|
TREND

Down
trend
|
MA10

Bearish
|
MA20

Bearish
|
STOCHASTIC

Overbought
|
|
|
|
|
MARKET ANALYSIS - Intraday Analysis
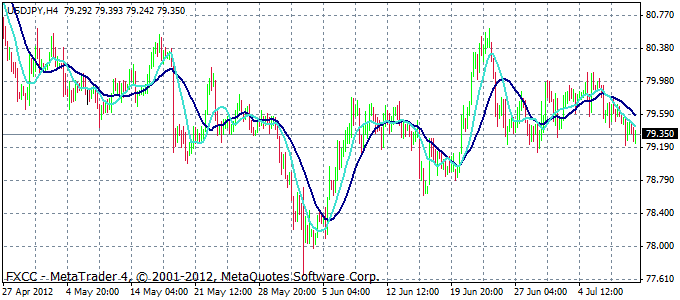
Technicals are reading bearish as the uptrend appears to have stalled, look to support at 200 day MA 78.99. At present the pressure is on the downside though and there is a greater risk for a downside break. But until such a break is seen, it is more reasonable to assume that the current consolidation will remain intact. Although some kind of a recovery can be expected in the short term. Supports are seen at 79.22 and then at 78.97. Whereas, resistance levels are seen at 79.62 and then at 79.78.
-
|
|
|
MARKET INFORMATION AND OPINIONS: Any information provided by FXCC
on this newsletter, including but not limited to news, research, opinions, analyses
and prices, is provided as commentary on the Forex market generally -- in other
words, it is not, and should not be considered as, investment advice. Consequently,
FXCC shall not be liable for any loss or damage, including but not limited to loss
of profits, which arises directly or indirectly from reliance upon or use of information
contained on this newsletter.
RISK WARNING: Trading in Forex and Contracts for Difference (CFDs) is highly speculative
and involves substantial risk of loss. It is possible to lose all your capital.
Forex and CFDs may not be suitable for all investors. Only invest with money you
can afford to lose. Please ensure you fully understand the risks involved before
investing. Seek independent advice if necessary.
|
|


