|
|
|
|

2012-07-02 05:37 GMT
Chinese PMI disappoints
U.S. stocks soared on Friday, and all three indexes closed out the first half of 2012 up more than 5%. NASDAQ has etched double-digit gains. Dow Jones closed the day up 278 points, or 2.2%. S&P 500 gained 33 points, or 2.5%. Nasdaq added 86 points, or 3%. A deal among European leaders to help struggling eurozone banks buoyed global markets Friday, at least temporarily erasing investors' looming fears over the viability of the eurozone. While stocks have clocked broad gains for the year, all three indexes closed out the second quarter below first quarter highs. Fears over Europe pushed stocks down nearly 10% in early June. Still, on Friday, investors looked solely at what was accomplished at the two-day European Union summit in Brussels. European leaders struck a "breakthrough" deal early Friday aimed at easing the recapitalization of banks. The European markets surged after European leaders agreed to the recapitalization plan and a tighter union. Britain's FTSE added 2%, DAX in Germany jumped 3.5% and France's CAC 40 rallied 3.8%.
Except for Shanghai, which trades marginally lower by 0.2%, all the other Asian indices are trading in the green. Nikkei & Strait Times are up by 0.1% & 0.5% respectively, while Taiwan is up by 0.4%. Kospi is trading on a flat note.
Among the metals, Aluminum lost 0.3% while Copper gained the most (2.4%). Zinc and Nickel rose by 2.2% and 0.2% respectively. Oil for August delivery rose $7.27 to $84.96 a barrel. Gold futures for August delivery as high as $53.8 to $1,604.2 an ounce
Coming up this week, the US will celebrates their Independence Day holiday in the middle of the week but the trading week will still have some important headlines, including a European Central Bank meeting and U.S. unemployment data. There will be an ECB rate announcement where expectations are of a 0.25% cut to a record low 0.75%., German and Spanish industrial production and airlines release traffic numbers.
Read More
|
|

2012-07-02 08:00 GMT
EMU - Markit Manufacturing PMI
2012-07-02 08:28 GMT
UK - Markit Manufacturing PMI
2012-07-02 09:00 GMT
EMU - Unemployment Rate (May)
2012-07-02 14:00 GMT
US - ISM Manufacturing PMI (Jun)
|

2012-07-02 04:45 GMT
GBP/USD consolidates around 1.5660
2012-07-02 04:19 GMT
BoE will ease more than expected, stay wary on Cable - UBS
2012-07-02 03:46 GMT
Probability to re-price RBNZ rate cuts - BNZ
2012-07-02 03:10 GMT
AUD/NZD down with regional PMI readings
|
|
|
|

|
|
|
|
|
|
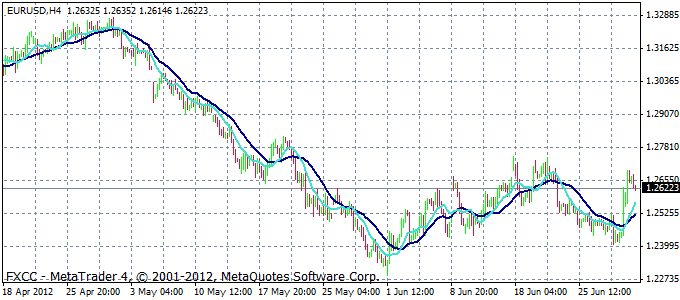
SUMMARY

Neutral
|
TREND

Sideway
|
MA10

Bullish
|
MA20

Bullish
|
STOCHASTIC
Neutral
|
|
|
|
|
MARKET ANALYSIS - Intraday Analysis
EUR/USD opened the week with bearish momentum, off from a high of 1.2676. The pair was likely to find support at 1.2408, Thursday’s low, and resistance at 1.2692, Friday’s high. The short term bias remains mildly on the upside for 1.2747. A break will target 100% projection of 1.2287 to 1.2747 from 1.2406 at 1.2866 next. Expect strong resistance from 61.8% retracement at 1.2902 this will limit the upside. A break below 1.2406 is needed to signal completion of the current move and a return to the bearish outlook.
-
|
|
|
|
|
|
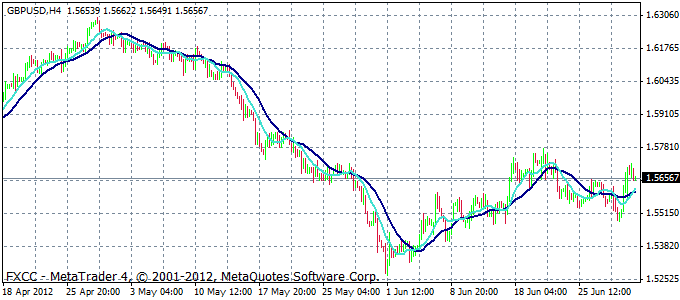
SUMMARY
Neutral
|
TREND

Up
trend
|
MA10
Bullish
|
MA20
Bullish
|
STOCHASTIC
Neutral
|
|
|
|
|
MARKET ANALYSIS - Intraday Analysis
Sterling is hanging at the key resistance area at the 1.57 level with the downward sloping trend line from the April 30th high connecting to the June 20th high at 1.56785. The upward channel trend line which was broken last week comes in at the 1.56818. The price is above the 38.2% retracement. This is all bullish for the pair. The next key target will come in at the 1.5748 level and then at 1.5783 (50% of the move down from April high) and 100 day MA at 1.5813.The pair could reverse and become bearish if it violates the1.5661 level and then the 1.5634 level.
-
|
|
|
|
|
|
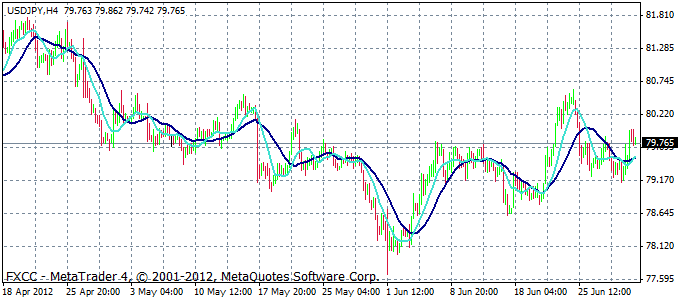
SUMMARY
Neutral
|
TREND

Down
trend
|
MA10

Bearish
|
MA20
Bullish
|
STOCHASTIC

Overbought
|
|
|
|
|
MARKET ANALYSIS - Intraday Analysis
Looking at the hourly chart the price has moved above the 100 and 200 hour MA at the 79.60 level (bullish). Staying above this level keeps the bulls in control. With a move below, the bullish bias disappears. The next upside targets become the 80.044 (61.8% of the weeks range) and the 80.14 (38.2% of the move down from the March 2012 high, and the key 100 day MA at the 80.56 level. A break above (or even below if the price cannot stay above the 79.50-60 area), should be met with increased momentum.
-
|
|
|
MARKET INFORMATION AND OPINIONS: Any information provided by FXCC
on this newsletter, including but not limited to news, research, opinions, analyses
and prices, is provided as commentary on the Forex market generally -- in other
words, it is not, and should not be considered as, investment advice. Consequently,
FXCC shall not be liable for any loss or damage, including but not limited to loss
of profits, which arises directly or indirectly from reliance upon or use of information
contained on this newsletter.
RISK WARNING: Trading in Forex and Contracts for Difference (CFDs) is highly speculative
and involves substantial risk of loss. It is possible to lose all your capital.
Forex and CFDs may not be suitable for all investors. Only invest with money you
can afford to lose. Please ensure you fully understand the risks involved before
investing. Seek independent advice if necessary.
|
|